

BÁO CÁO PHÁT TRIỂN BỀN VỮNG 2023
For manufacturing plants in general, water usage is essential. At PVCFC, the majority of water consumption at the Ca Mau Fertilizer Plant is used for the following purposes: boiler feed water for steam production; river water for open recirculating cooling water system; fresh water for closed recirculating cooling water system, and other uses serving the requirements of the production technology. Additionally, daily activities generate wastewater at both the Ca Mau Fertilizer Plant and the two offices in Ho Chi Minh City and Ca Mau.
For the PetroVietnam Packaging Joint Stock Company, 100% of the water used comes from the supplied water source. The company does not generate production wastewater. All wastewater used in production is 100% recycled and reused. Sanitary wastewater is treated through septic tanks (wastewater from restrooms) or pre-treated (wastewater from kitchens and handwashing) and then discharged into the industrial zone’s drainage system.
PVCFC consistently monitors and manages the use of clean water and river water to ensure it is done efficiently and conservatively. Additionally, PVCFC ensures compliance with legal regulations related to water resource management, as follows:

Ensure the extraction and use of river water is conducted according to the intended purpose, extraction location, extraction method, and water intake flow rate as permitted by the Ca Mau Provincial People’s Committee under Permit No. 11/GP-UBND dated March 26, 2012.
Comply with the payment of water resource exploitation fees as per the regulations of Decree 54/2024/NĐ-CP dated May 16, 2024.
Monitor the quality of treated wastewater to ensure it consistently meets the standards of QCVN 40:2011/BTNMT/ as approved by the Ministry of Natural Resources and Environment under Environmental Permit No. 405/GP-BTNMT dated December 30, 2022, before discharge into the environment, preventing any negative impact on the surrounding water environment near the plant.
The company also develops and publicly implements a plan for environmental incident prevention and response in accordance with the regulations.
The total volume of river water extracted and the total volume of wastewater generated at the Ca Mau Fertilizer Plant depend on the Plant’s operating capacity, and currently, both volumes are within the extraction and discharge limits permitted by the relevant government authorities

The Company always considers water as a valuable resource and actively uses it efficiently while strictly managing the quality of wastewater before returning it to the environment. Wastewater is only discharged into the environment (Ong Doc River) after being treated to meet QCVN standards/ permissible values set by the Ministry of Natural Resources and Environment.
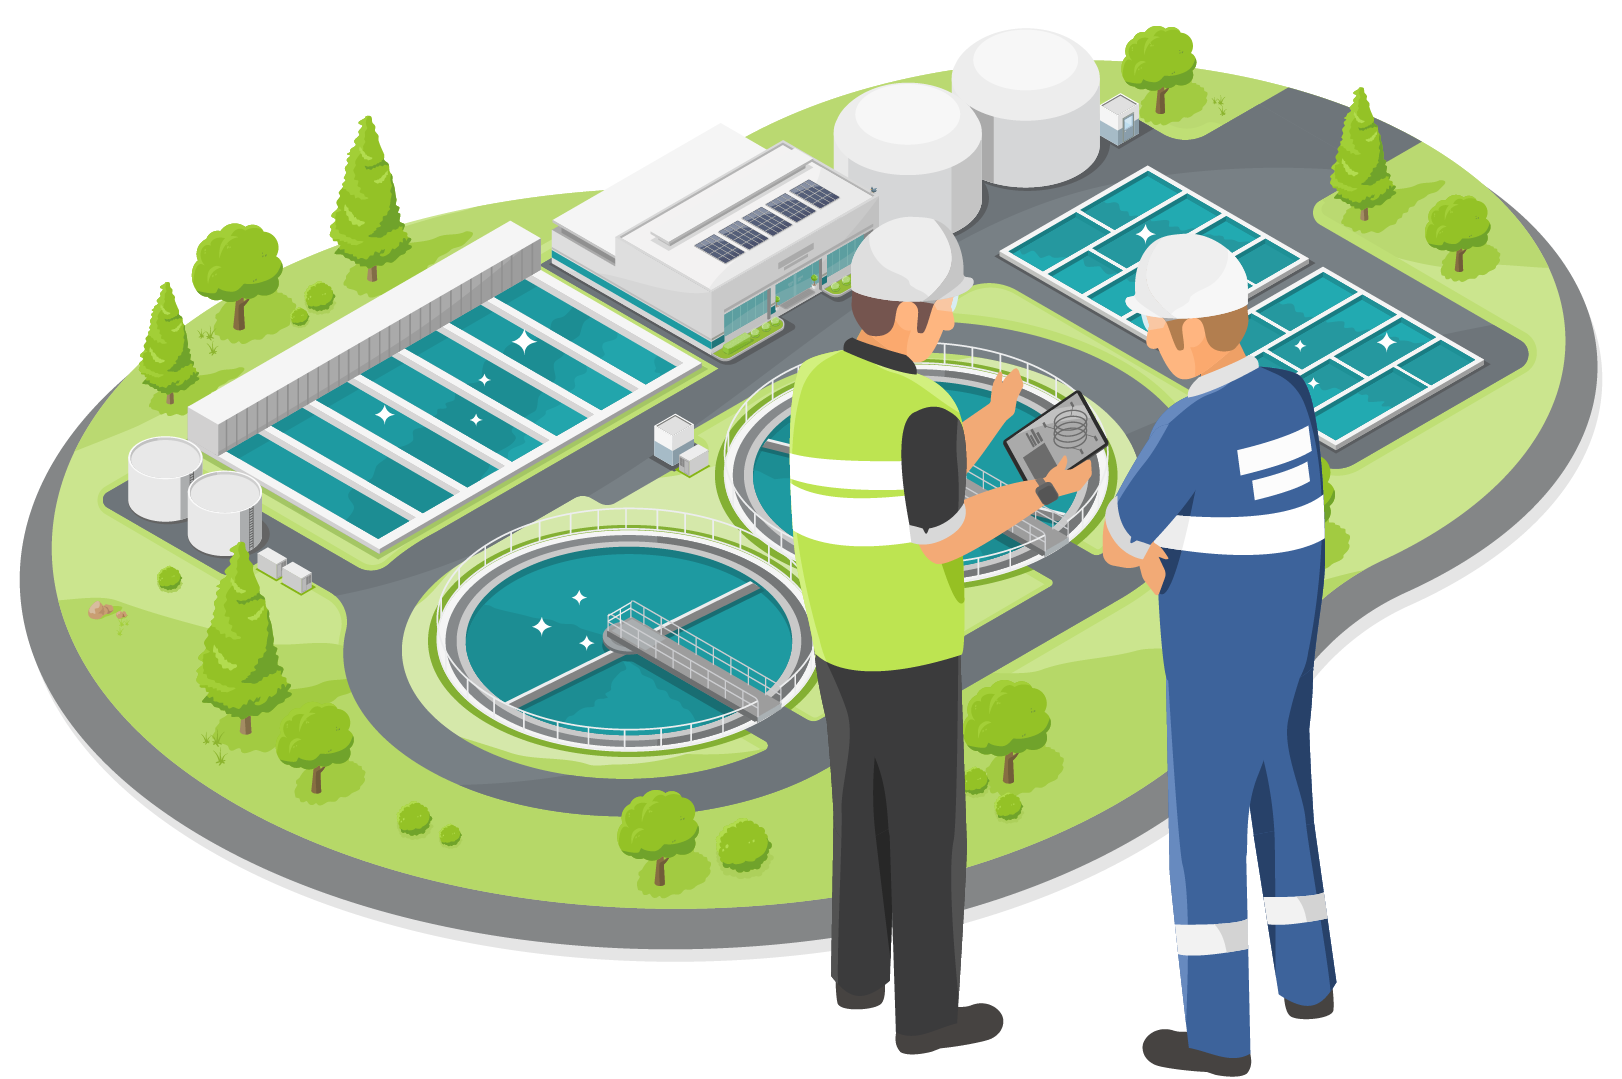
The Ca Mau Fertilizer Plant has three environmental protection works for wastewater, which have been in operation since 2012 and are currently operating stably, as detailed below:
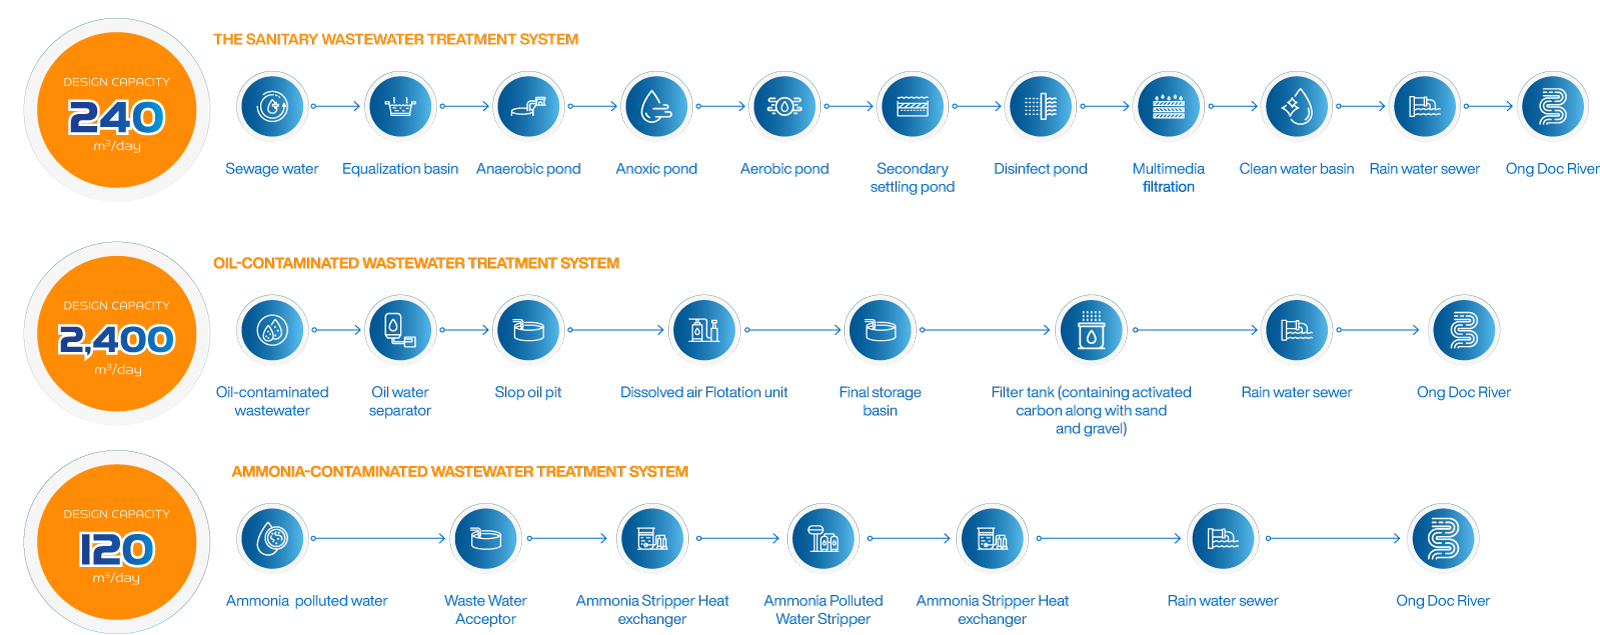

To ensure that the quality of treated wastewater consistently meets QCVN standards, the Company has contracted a qualified organization to perform periodic wastewater monitoring every three months at the outlets of the treatment systems. Additionally, the Plant has installed two continuous automatic wastewater monitoring stations:
Thanks to water-saving measures and the awareness of each employee, along with operating the plant at higher capacity, the amount of water consumed per ton of product in 2023 was reduced by 0.15%. It is expected that by the end of 2024, we will implement a project to recover discharge water from the existing RO system, which is estimated to save up to 4.1 billion VND annually and reduce the amount of chemicals used in the water treatment system.
The urea fertilizer production technology at the Ca Mau Fertilizer Plant uses key raw materials such as natural gas, electricity, water, and a certain amount of air from the environment. However, the two most important energy sources used are natural gas and electricity, as they account for the majority of energy value and production costs. The use of natural gas and electricity has a direct impact on the environment, green economy, and society, particularly concerning climate change issues. The energy sector is the largest source of greenhouse gas emissions, with 90% of CO2 and 75% of other greenhouse gases coming from developing countries. Of these emissions, 95% are CO2, and the remainder is CH4 and N2O. Emissions are categorized into three groups: fossil fuel combustion (accounting for 70% of total emissions), instantaneous emissions from equipment, and carbon capture and storage activities. Power plants, refineries, and fertilizer production facilities are the main sources of these emissions.
Natural gas is a non-renewable, irreplaceable resource and could be one of the most significant risk factors if there is a shortage of this gas for production at the Ca Mau Fertilizer Plant. In recent years, Vietnam’s fertilizer production industry has made strong advancements. From a point where nearly 60% of the supply had to be imported, Vietnam has now become self-sufficient in urea, meeting the demands of agricultural production and developing new types of fertilizers such as DAP and Potassium. Vietnamese companies, including PVCFC, have invested in depth, modernized technology and equipment, and improved the nutritional content and quality of phosphate and NPK fertilizers. Domestic fertilizer production plants can now meet the demand for urea, phosphate, and NPK fertilizers and are moving towards exporting some products. The current domestic demand for fertilizers is about 11 million tons, with inorganic fertilizers accounting for about 90%, while organic fertilizers and some other types account for only about 10%. The stable and sustainable development of the fertilizer production sector not only helps farmers across the country have a stable, high-quality fertilizer supply but also significantly contributes to ensuring national food security.

At PVCFC, we have recognized this trend and have proactively established research groups, organized visits, and studied the production practices at manufacturing plants that use solar energy to produce green hydrogen for other industries, green ammonia production, and green fertilizer production. In parallel, we are actively seeking solutions, discussing, and consulting with licensors on the potential integration of green hydrogen from water electrolysis technology using solar and renewable energy.
Energy Saving. Accordingly, PVCFC has implemented several control measures and ensured compliance with theCompany’s material consumption standards for types of product, consistently managing annual consumption and reducing energy use.
The technological improvement initiatives from 2022 to the present have contributed to reducing CO2 emissions at PVCFC, specifically as follows:
The technological improvement initiatives from 2022 to the present have contributed to reducing CO2 emissions at PVCFC, specifically as follows:
Increasing Operational Capacity to 115% Load by the Strategic Target Year
of 2025.
Since 2021, the Ca Mau Fertilizer Plant has consistently maintained a high capacity of 110%, surpassing other plants (109%) and even setting a record of 115.5% operational capacity in 2023 with a relatively low energy consumption. At the end of 2022, the Ca Mau Fertilizer Plant was honored by Haldor Topsoe with the “Top 10% of Plants with the Lowest Energy Consumption in the World” certificate and is among the top 10% of plants globally in terms of high capacity.
In 2023, PVCFC issued an energy management model and is currently reviewing policies
and activities to manage energy effectively and comprehensively, aiming to develop an energy management
model according to ISO 50001:2018. To seek optimal solutions, PVCFC has registered to participate in the
DEPP3 Program, “Vietnam-Denmark Energy Partnership Program Phase 2020-2025,” which aims to support the
promotion of energy efficiency in industrial sectors through the development and piloting of a Voluntary
Agreement Program and capacity building for large energy-consuming enterprises in Vietnam.
Implement plans to harness green energy and partially substitute low greenhouse gas emission energy sources to increase the efficiency of green energy use annually, in compliance with Decree 06/2022/NĐ-CP on greenhouse gas emission reduction and ozone layer protection, and in line with Vietnam’s national action plan on its commitment to achieving CO2 emissions targets at COP 26, with the goal of net-zero emissions by 2050.
Rooftop solar power renewable energy project at the Ca Mau Fertilizer Plant.
Project to integrate green hydrogen production from electrolysis using renewable energy
Project to recover CO2 from the existing natural gas stream to reduce CO2 emissions
Project to recover CO2 from the flue gas stream from the main units.

Innovation and Improvement Initiatives: PVCFC encourages employees to
propose solutions related to equipment, technology, and daily production and work processes. The
company conducts acceptance testing, approves proposals, and rewards employees for their initiatives.
Some energy-saving solutions implemented during the 2022-2023 period are described above.
Promotion of Efficient and Energy-Saving Practices: PVCFC has developed solutions to save electricity, strictly adhering to regulations on economical and efficient electricity use, and implementing the unit’s annual electricity-saving plan to raise awareness and foster habits of energy conservation in all company activities. The company also aims to reduce energy loss and waste while enhancing the effectiveness of the energy management system. PVCFC regularly instructs units, departments, and sections to practice electricity conservation in a practical, reasonable, and effective manner. Special emphasis is placed on informing all employees and workers about legal regulations on energy conservation, including the Prime Minister’s Directive 20/CT-TTg, directives from the Group, and the unit’s regulations and plans for efficient electricity use (through internal communication channels: website, email, newsletters, etc.). Employees and workers are required to seriously implement electricity-saving measures and to promote and encourage their families, friends, and those around them to do the same.
The majority of energy is consumed at the Ca Mau Fertilizer
Plant.
According to the business production plan through 2025. as approved in Resolution No. 6395/NQ-DKVN of the Vietnam Oil and Gas Group. the goal set for the Ca Mau Fertilizer Plant is to achieve a 5% reduction in energy consumption by 2025 compared to the 2022 baseline. After continuous improvements and production optimization. the energy consumption rate in 2023 was reduced by 4.23% compared to the 2022 baseline.
Regarding electricity energy. we always focus on reducing and using electricity efficiently. including both purchased and self-generated electricity. We continuously seek technological solutions to utilize excess heat and waste heat to contribute to generating useful electricity. which helps save energy and optimize the operational cycle of the Plant. In 2023. electricity consumption increased in line with the growth in production output. and the total electricity usage intensity at PVCFC decreased by 0.22% compared to 2022. as detailed below:
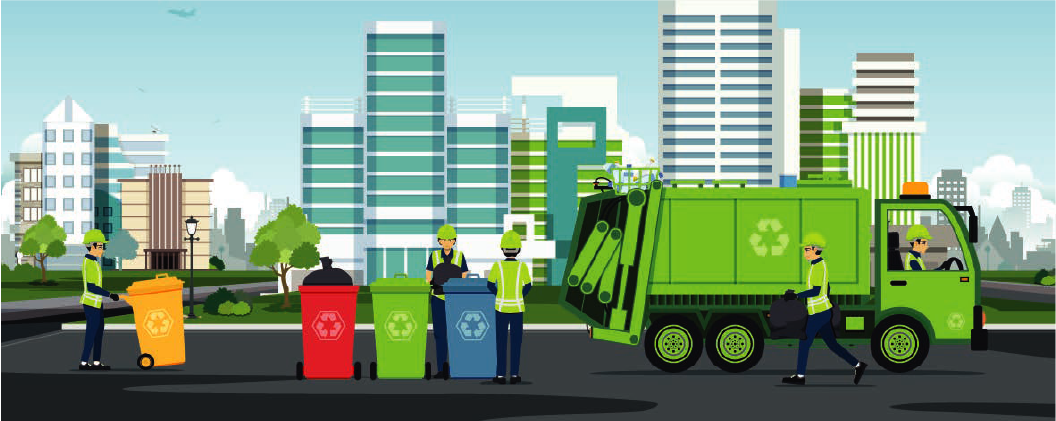
PVCFC always focuses on controlling solid waste generated at the Ca Mau Fertilizer Plant to ensure compliance with current legal regulations. In PVCFC’s operations, the types of waste and the methods by which we manage them are as follows:
Waste from production is collected, classified, and transferred to qualified units for processing, with the transfer records managed according to Decree 08/2022/NĐ-CP dated January 10, 2022.
The equipment, systems, and facilities for storing hazardous waste, ordinary industrial solid waste, and domestic solid waste are fully compliant with the requirements set out in Circular No. 02/2022/TT-BTNMT dated January 10, 2022.
The sources of waste and the corresponding management methods at PVCFC are as
follows:
Generated from offices, cafeterias, canteens, restrooms, etc., collected in
240-liter bins with lids (green) at the source and transferred to Ca Mau Urban Environment Joint Stock
Company for processing according to regulations. The total amount of domestic waste generated was 112,760
kg in 2023 and 110,426 kg in 2022.
Primarily from the Mechanical Workshop, Electrical Workshop, and Control
Workshop, including non-hazardous materials like iron, steel, unused equipment, wood scraps, and waste
pallets. Wood scraps, broken pallets, plastics, scrap metal, etc., are collected in 240-liter bins (blue)
placed at the source. The waste is then gathered in a temporary storage warehouse with an area of 336 m².
The temporary storage warehouse is designed according to regulations (the warehouse floor is made of
reinforced concrete, with surrounding rainwater collection trenches, lighting, ventilation systems, and
emergency response equipment (firefighting equipment)). For this type of waste, the Company contracts with
a qualified organization for processing according to regulations. The total amount of OISW generated was
63,288 kg in 2023 and 66,752 kg in 2022.
Hazardous waste is classified and collected at the source, temporarily stored at the Plant’s hazardous waste storage facility, and then transferred to a qualified organization for processing according to legal regulations. Hazardous waste generated is collected in plastic containers with storage volumes ranging from 20 to 660 liters, or 200-liter metal drums, labeled with hazard signs, codes, and the name of the hazardous waste. These containers are placed at the waste generation sites and temporarily stored in a warehouse with an area of 570 m², designed according to regulations (reinforced concrete, sloped warehouse floor with trenches to collect liquids into two collection pits in case of chemical leaks, lighting and ventilation systems, emergency response equipment: firefighting equipment, chemical absorbent pads, and absorbent sand). The Company contracts with a qualified organization to transfer and processing according to regulations, ensuring that the generated waste does not affect the surrounding environment.
Details of hazardous waste quantities are classified by waste name, waste code, and source of generation as listed below:
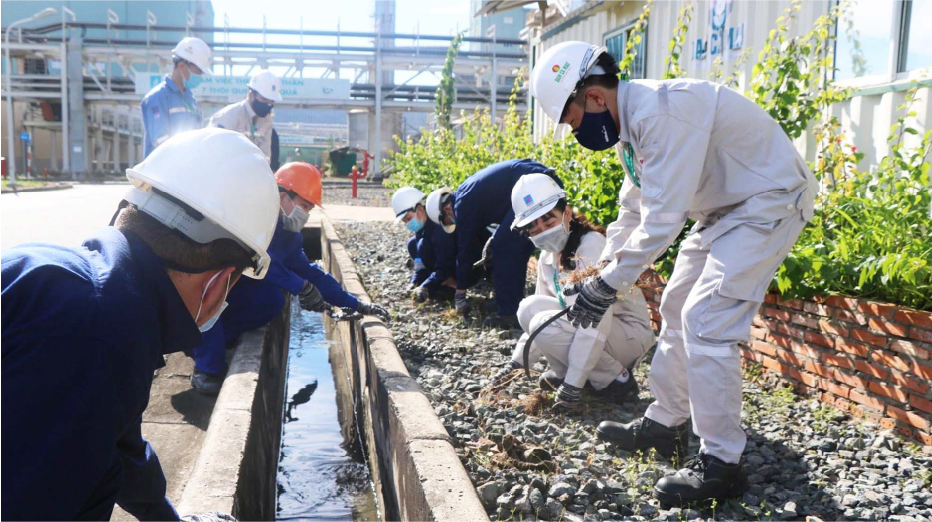
With the waste management methods described above, the detailed results of waste treatment in 2023 are as follows:
Ordinary Industrial Solid Waste (OISW)
Chất thải sinh hoạt
Hazardous Waste
Organizations and individuals receiving domestic solid waste (DSW): Moc An Chau Foreign Trade Warehousing and Forwarding Joint Stock Company – Environmental permit No. 140/GPMT-BTNMT dated 07/07/2022
Percentage processed (%): 100%
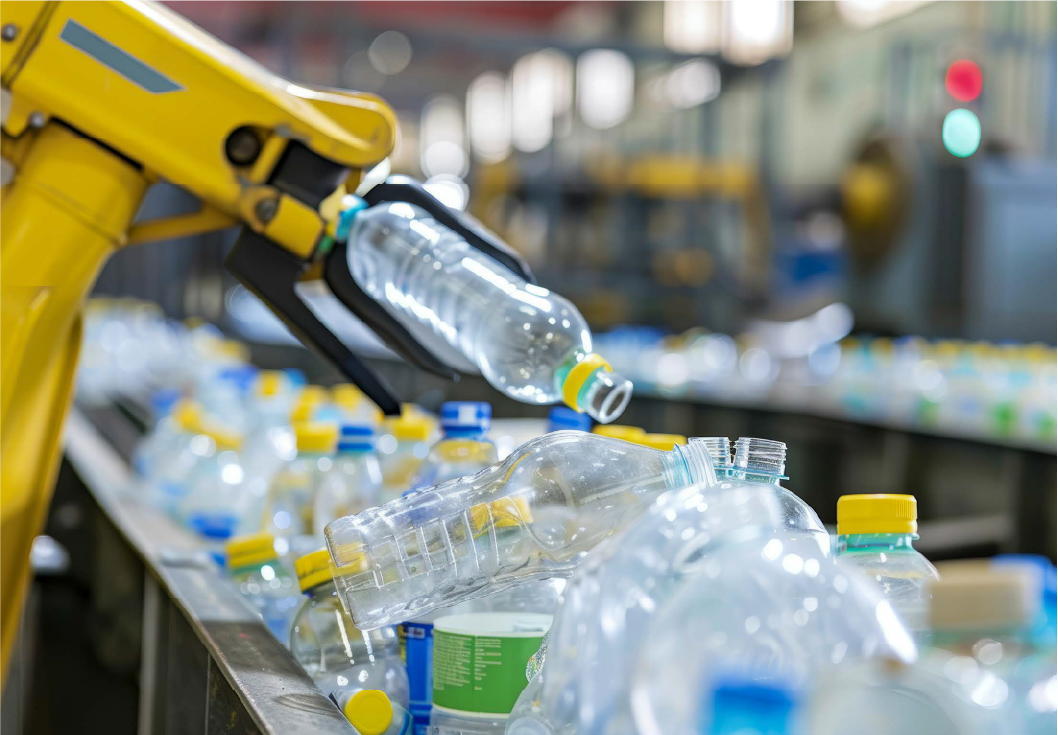
The company consistently fulfills its recycling responsibilities for the quantity of commercial packaging used to contain fertilizers distributed in the Vietnamese market. In fulfilling this recycling responsibility, the company chooses to make financial contributions to the Vietnam Environmental Protection Fund in accordance with the provisions of Decree No. 08/2022/NĐ-CP dated January 10, 2022.
Noise pollution, especially high-intensity noise, can affect workers’ hearing if they
are exposed for extended periods. Therefore, the company places great emphasis on finding solutions to
reduce noise in order to minimize its impact on employees working at the plant and the surrounding
residential areas.
The main sources of noise in the production activities at Ca Mau Fertilizer Plant come
from the ammonia and urea workshops; the equipment in these workshops operates continuously 24 hours a day
and is designed to run fully automatically, meaning that very few workers need to be present in these areas.
Additionally, workers operating in these workshops are fully equipped with personal protective equipment as
required, so the level of noise impact within the plant premises on workers’ health is negligible.
Noise Pollution Management Methods:
Periodically inspect and maintain equipment to ensure the system operates stably
and minimizes noise generation.
Establish green buffer zones between the project area and residential areas by
planting new trees around the plant area to reduce noise and contribute to ecological restoration.
Ships docking at the fertilizer loading terminal must strictly comply with waterway traffic regulations and avoid sounding horns during residential quiet hours.